3 month progress update with insane results for a small client, their Amazon 3P and DTC eCommerce numbers, fully revealed.
DTC Only: .com Website Results
Result: $2,411,283 ARR in increased revenue for the same number of visitors.
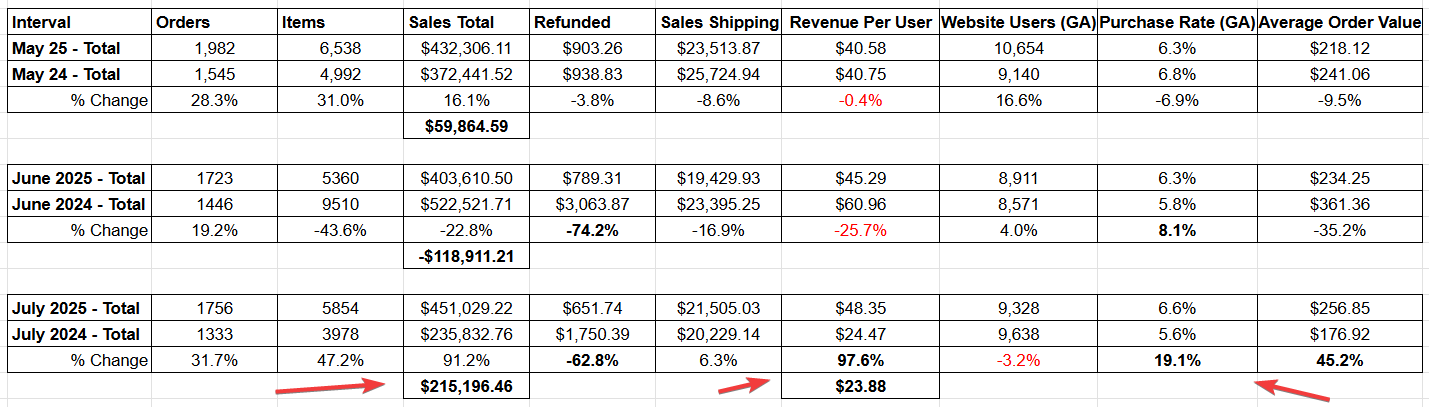
MOM Data for .com, Revenue Per User +97.6%. Note: In June 2025, the brand ran out of stock (about 10 days) due to a production error with bottle labels.
What We Changed
- Added 90 Day Guarantee, 250,000 Happy Customers, and Free Shipping on USD$99+ to all website pages.
- Added trust elements in store checkout pages and made image carousel changes. Many of the changes did not take effect until July, and some major changes not until the end of the month.
- Added whole site UI/UX update and Qualifying Survey directing users to detail pages.
No-brainers? Yes, absolutely.
Concerns We Had
Refunds would spike. Loss of revenue due to free shipping.
Goals: Increase Revenue Per User, increase Average Order Value, increase conversion rate, reduce Abandoned Carts. All of this without increasing refund rates.
The Numbers
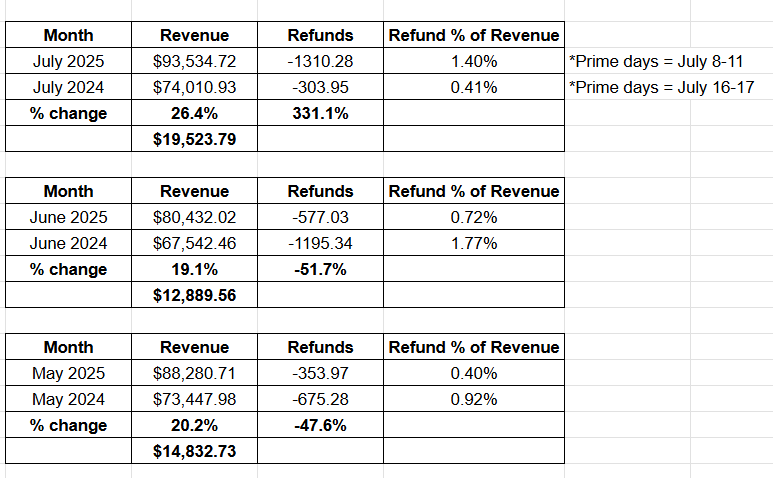
Refunds: Comparing May 2025, June 2025, and July 2025, they are all LOWER than 2024 for the same periods. July 2025 refunds are 62.8% lower than July 2024.
Revenue Per User: Up 97.6% in July versus last year, even though we had 3.2% fewer website users. If July's numbers are extrapolated onto the total number of users for last year, it yields an increase in revenue for 100,975 users for the additional $23.88 in Revenue = $2,411,283 in increased revenue for the same number of visitors.
Average Order Value: Magento data accounts for Retail, Wholesale, and Phone Orders. But all three months show an increase in AOV. July was a 45.2% increase compared to the same period last year.
Shipping Sales Revenue: It does not show a dip in total dollars, but as a percentage of Revenue, we did lose about $20K in shipping revenue in July comparatively. But we added $215,196.46 for a net gain of ~$195,200.
Conversion Rate / Purchase Rate: Purchase rate in June was up even though we had several website outages and were out of stock for the top seller hero product. July showed the real fruits of our labor: an increase of 19.1% in Conversion to Purchase.
Cart Abandonment & Buyer Intention
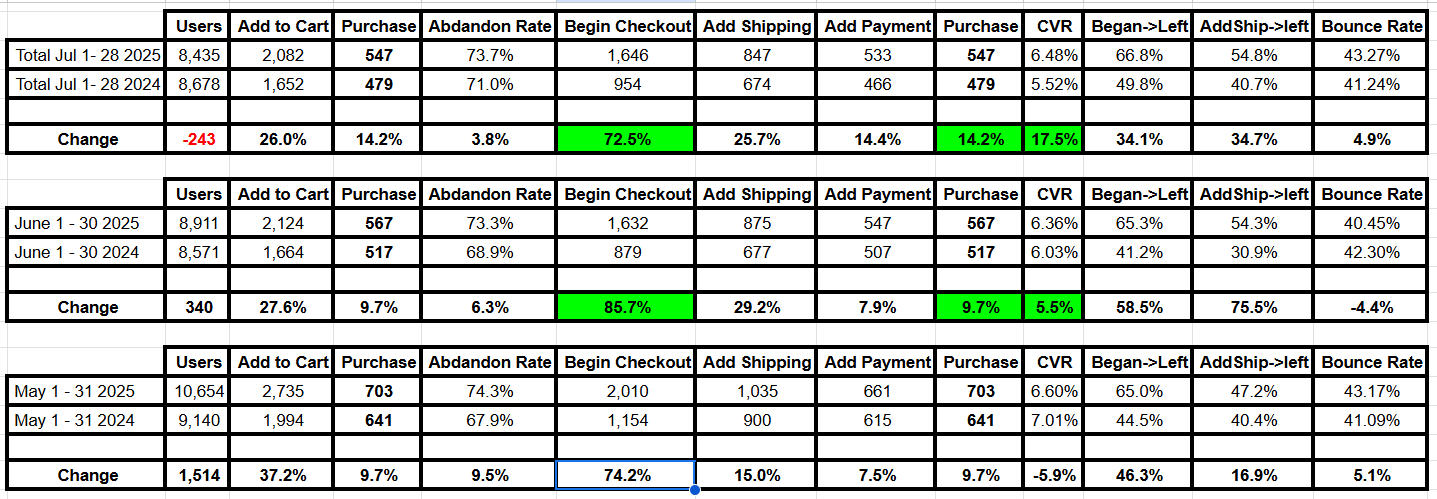
MOM Data for .com Website: Buyer Intention Increased Across the Board.
Long story short: We have drastically improved the User's intention to buy. Even though Cart Abandonment is up a little (3.8%) and bounce rate is up a little (4.9%), everything that really matters is going atmospheric.
- Add to Cart: 37.3% increase in the number of items added to cart in July. That explains the slight increase in Abandonment, but we still sold significantly more.
- Beginning Checkout: Up 72.5% in July. More people are completing checkout (and probably more are calling to order by phone).
Conclusion: We are making great progress and have just started making headway, with much more potential progress to come.
Amazon Only: Record-Breaking Growth
MOM Amazon Only, 19%-26% Revenue Growth After Only 3 Months.
Revenue: Best Month Ever
We had our best month ever on Amazon, up 26.4% over the same period last year. We beat the previous record set in May 2025.
June and May were also better than last year. (I started helping them May 1st.)
Conversion Rate Boost
We made some modest changes (meaning there's plenty more we can and will do). Most changes focused on their best-selling product, affecting June and July. We updated the Amazon Detail Page bullet points to include verbiage about accepting returns (this is in the food/beverage niche; they normally don't have returns or refunds) and added changes to some of the images.
The results for July: 74.5% of all visitors to the top-selling product's Product Detail Page purchase the product. Up from an already very high 45.9% in April (before any changes).
That is an increase of 63% conversion rate for the Amazon detail page.
We made more changes on 7/30 to the entire image carousel, which should give us even more lift. We haven't even touched the bullet points yet on several SKUs.
New FBA Logistics
I made changes to the FBA Inventory Send-to-Amazon process and instituted a new SOP with their in-house Amazon Channel Manager (I'm training him).
Annual Savings for Amazon FBA: 13,058 Units x $0.75 per unit ($1,080.55 / 1,440) = $9,798.49 Annually
Dan Matejsek is the founder of RavingFans.ai and creator of PerfectASIN. 27 years of e-commerce experience. $572M in career online revenue. He currently consults with Amazon brands on listing optimization, advertising strategy, and AI-powered growth.
Consulting inquiries: ravingfans.ai · All articles: ravingfans.ai/blog